

 |

|
Definitions in this text:

Essentials, Section 1
Basic Concepts of Economic Value
This section explains the basic economic theory and concepts of economic valuation.
Economic value is one of many possible ways to define and measure value. Although other types of value are often important, economic values are useful to consider when making economic choices ・ choices that involve tradeoffs in allocating resources.
Measures of economic value are based on what people want ・ their preferences. Economists generally assume that individuals, not the government, are the best judges of what they want. Thus, the theory of economic valuation is based on individual preferences and choices. People express their preferences through the choices and tradeoffs that they make, given certain constraints, such as those on income or available time.
The economic value of a particular item, or good, for example a loaf of bread, is measured by the maximum amount of other things that a person is willing to give up to have that loaf of bread. If we simplify our example ・economy・ so that the person only has two goods to choose from, bread and pasta, the value of a loaf of bread would be measured by the most pasta that the person is willing to give up to have one more loaf of bread.
Thus, economic value is measured by the
most someone is willing to give up in other goods and services in order
to obtain a good, service, or state of the world. In a market economy,
dollars (or some other currency) are a universally accepted measure of
economic value, because the number of dollars that a person is willing
to pay for something tells how much of all other goods and services they
are willing to give up to get that item. This is often referred to as ・willingness
to pay.・
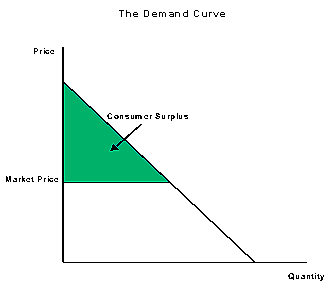
In general, when the price of a good increases, people will purchase less of that good. This is referred to as the law of demand・people demand less of something when it is more expensive (assuming prices of other goods and peoples・ incomes have not changed). By relating the quantity demanded and the price of a good, we can estimate the demand function for that good. From this, we can draw the demand curve, the graphical representation of the demand function.
It is often incorrectly assumed that a good・s market price measures its economic value. However, the market price only tells us the minimum amount that people who buy the good are willing to pay for it. When people purchase a marketed good, they compare the amount they would be willing to pay for that good with its market price. They will only purchase the good if their willingness to pay is equal to or greater than the price. Many people are actually willing to pay more than the market price for a good, and thus their values exceed the market price.
In order to make resource allocation decisions based on economic values, what we really want to measure is the net economic benefit from a good or service. For individuals, this is measured by the amount that people are willing to pay, beyond what they actually pay. Thus, two goods that sell for the same price may have different net benefits. For example, I may have a choice between wheat and multi-grain bread, which both sell for $2.00 per loaf. Because I prefer multi-grain, I am willing to pay up to $3.00 for a loaf. However, I would only pay $2.50 at the most for the wheat bread. Therefore, the net economic benefit I receive for the multi-grain bread is $1.00, and for the wheat bread is only $.50.
The economic benefit to individuals is often measured by consumer surplus. This is graphically represented by the area under the demand curve for a good, above its price.
Economic values are also affected by the changes in price or quality of substitute goods or complementary goods . If the price of a substitute good changes, the economic value for the good in question will change in the same direction. For example, wheat bread is a close substitute for multi-grain bread. So, if the price of multi-grain bread goes up, while the price of wheat bread remains the same, some people will switch, or substitute, from multi-grain to wheat bread. Therefore, more wheat bread is demanded and its demand function shifts upward, making the area under it, the consumer surplus, greater.
Similarly, if the price of a complementary good, one that is purchased in conjunction with the good in question, changes, the economic benefit from the good will change in the opposite direction. For example, if the price of butter increases, people may buy less of both bread and butter. If less bread is demanded, then the demand function shifts downward, and the area under it, the consumer surplus, decreases.
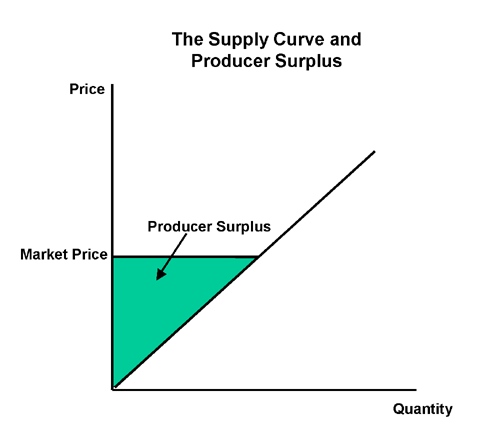
Producers of goods also receive economic benefits, based on the profits they make when selling the good. Economic benefits to producers are measured by producer surplus, the area above the supply curve and below the market price. The supply function tells how many units of a good producers are willing to produce and sell at a given price. The supply curve is the graphical representation of the supply function. Because producers would like to sell more at higher prices, the supply curve slopes upward.
If producers receive a higher price than
the minimum price they would sell their output for, they receive a benefit
from the sale・the producer surplus. Thus, benefits to producers are
similar to benefits to consumers, because they measure the gains to the
producer from receiving a price higher than the price they would have been
willing to sell the good for.
When measuring economic benefits of a policy
or initiative that affects an ecosystem, economists measure the total net
economic benefit. This is the sum of consumer surplus plus producer
surplus, less any costs associated with the policy or initiative.
Continue to:
Essentials, Section 2 ・ Valuation of Ecosystem Services
Back to:
Essentials of Ecosystem Valuation


