|
|
Steps in Developing Relative Value Indicators |
Links Between "Green Payments" and Environmental Benefits
Prioritizing public investments in conservation practices on the basis of intuition or a few "rules of thumb" can work sometimes. However, the essential links between "green payments" and environmental benefits are often too complicated to expect that general decision rules will be effective and avoid waste.
The table below presents seven stages of benefit development that link "green payments" with expected environmental benefits. Each stage and each of the links between successive stages link can be evaluated separately with respect to each type of expected environmental benefit. What is good for fish may not be good for fowl, or for downstream water quality. Links that favor one type of benefit, in other words, may not favor others. The accessibility of a site to certain types of wildlife and to people may generate certain benefits, but have an adverse effect on the survivability of some species. Restoring a small degraded wetland that provides a critical wildlife corridor or is the only source of environmental amenities in a community may generate more of some kinds of benefits than restoring a much larger wetland or constructing a forested buffers in a more remote area. There are always tradeoffs involved in selecting among competing investments, and indicators that reflect critical linkages with respect to different types of benefits help clarify these tradeoffs.
Indicators based on the linkages listed above will be useful for comparing changes in various types of benefits. However, comparing the overall benefits from investing in different projects or sites may require assigning preferences to different types of benefits. If fishing opportunities are rare and people consider increasing them to be twice as important as increasing already abundant bird-watching opportunities, for example, investments that increase fishing opportunities a little may be more beneficial than investments that increase bird-watching opportunities a lot.
Some of the conceptual and technical aspects of developing indicators are dealt with in the Food for Thought section. However,an indicator can be defined generally as a measure of anything that provide clues about matters of greater importance. The matters of greater importance in our case are the benefits expected from a conservation practice undertaken at a specific site. In practice this means that anything that reflects conditions that limit or enhance the likelihood of progressing from one stage to another in the following chart is a good candidate for becoming the focus of an indicator.
|
Stage
|
Indicator
Type
|
Focus
of Attention
|
|
1
|
financial incentives
|
Eligibility
criteria, project ranking criteria, level of funding, allocation
of funds, etc.
|
||||
|
lead to changes in . . .
|
||||||
|
2
|
conservation practices
|
Conservation
tillage, wetland restoration, riparian buffers, noxious weed control,
manure management, reduced fertilizer/pesticide use, irrigation
practices, etc.
|
||||
|
which results in . . .
|
||||||
|
3
|
biophysical effects
|
Reduced
sediment, nutrient, contaminant runoff, reduced use of water, energy,
manpower; change in mix of seasonal/permanent ground cover, etc.
|
||||
|
which improve . . .
|
||||||
|
4
|
the state of environment
|
Improved
habitat for fish, birds, fur-bearing animals; increased water/air/soil
quality; reduced sedimentation
|
||||
|
which generates . . .
|
||||||
|
5
|
improved environmental functions
|
|
||||
|
which results in . . .
|
||||||
|
6
|
improved environmental services
|
|
||||
|
which are the source of . . .
|
||||||
|
7
|
socioeconomic benefits
|
|
15 Essential Questions About Relative Ecosystem Values
The first few stages depicted in the chart above deal with whether a "green payment" will provide incentives for landowners to undertake conservation practices that will change onsite features. The rest of the stages address whether changing features at a particular site will affect ecosystem functions, services and values. The following questions provide a basis for developing indicators based on whether a conservation practice at a given site will result in ecosystem benefits.
Functions
1. What environmental functions does this site have the capacity to provide?Services2. Does the site's landscape context allow it to provide these functions? If so, are there factors that will cause it to function below capacity?
3. Are there factors that may cause it to function beyond its sustainable capacity?
4. What services, products, and amenities will these ecosystem functions generate?Values5. Over what geographic area will people benefit from these services and products?
6. How scarce are these services, products, and amenities in the region?Risk7. How many people benefit from them; what is their income, ethnicity, etc.?
8. How much does it cost in money or time for people to enjoy these services?
9. Are there near-perfect natural and man-made substitutes that exist or could be developed?
10. How could the affected population adapt to having fewer of these services?
11. How much would the affected population benefit from having more of these services?
12. Will demographic/land use change increase/decrease preferences or availability for these services?
13. How might future development make the services provided here more/less important? More or less vulnerable?14. How vulnerable are services generated by this site to temporary/permanent disruptions?15. How restorable are these services in this region compared to other regions?
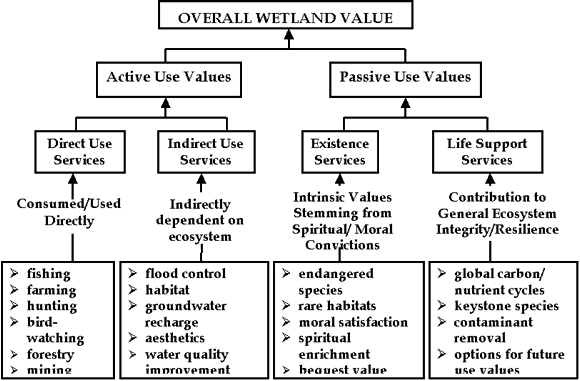
Ecosystem values include "active use " values and "passive use" values as depicted in the figure below. Environmental investments at a particular site often generate active and passive values that accrue on or near the site as well as many miles away. In fact, the offsite passive use values associated with many environmental investments often far exceed their onsite active use values. Because of the difficulties in measuring offsite and nonuse values in terms of dollars, these values must be accessed and compared using indicators.

Five Sets of Landscape Characteristics to Consider
1 adjacent & nearby hydrological./geological features (e.g., upslope/downslope gradients, proximity to water bodies, floodplains) 2 connection to fish, wildlife, fur-bearer habitats (e.g., flyways, wildlife corridors, other ecosystem areas) 3 proximity to residential, commercial, industrial land uses, and to roads, parking lots, rights of way, and other property interests 4 size/ age/ mobility/ ethnicity/ geographic distribution of local, regional population and others who benefit 5 income and asset characteristics of the population; ranking of preferences for various ecosystem services; ranking of concerns about public health and ecosystem risks These five categories of indicators may be combined to generate a single overall index of ecosystem value.
Indicators of site conditions that determine an ecosystems ability to provide various functions Indicators of landscape conditions that determine how much of the functional capacity of the site is likely to be used. Indicators of landscape conditions that limit or enhance the level of services expected per unit of function. Indicators of local, regional, and national supply and demand conditions, individual and community preferences, and the substitutability of the service, which reflect the expected value per unit service. Indicators of the likelihood of future disruptions in service flows that affect the value of expected ecosystem services. These are related to the exposure and vulnerability of the site or other critical landscape features to such threats as floods, droughts, fire, disease, infestations, water diversion, pollution, and industrial development. Click for a graph depicting flow of indicator development using the factors listed above.
Stage 1 - Develop the Tools
Tools
are the analytical framework behind the indicators.
| 1.1 Identify critical links between conservation practices and resulting improvements in environmental functions, services, and values |
| 1.2 Determine limiting or enhancing factors that affect these critical links and provide a basis for comparing the beneficial outcome of conservation practices |
| 1.3 Identify useful indicators of those limiting and enhancing factors |
| 1.4 Test and validate those indicators |
Stage 2 - Organize the Data
The basis
for applying the indicators
| 2.1 Identify existing data sources |
| 2.2 Identify data gaps sources of data to fill them |
| 2.3 Assemble regional databases |
| 2.4 Develop site-based and landscape-based indicators |
Stage 3 - Prepare Guidance
How to
estimate and apply the indicators as guidance for applying conservation
benefit indicators cannot be developed until more is known about how the
indicators will be developed. The indicators should not be developed until
more is known about the types of information that are available to apply
them. Table 3 below lists the types of landscape and demographic information
that are available in most regions and might be used as a checklist for
determining what types of data are available to NRCS field staff.
| 3.1 Illustrations and case studies |
| 3.2 Background on indicator development and application |
| 3.3 Sources of generic indicators and regional adjustment factors |
| 3.4 Methods of applying and interpreting indicators |
| 3.5 Using indicators to develop project eligibility and ranking criteria |
| 3.6 Defending indicators as a basis for managing spending |
The following
chart provides an illustration of a six-step process for determining which
linkages are most important and how differences in regional preferences
might affect the development of indicators.
| STEP 1 | Determine natural resources at risk and likely causes of risk | |||||||
Identify
|
by
answering . . .
|
| Step 2 | Determine community preferences and values | ||||||
|
General
Preferences
|
Specific
Benefits
|
| Step 3 | Link services and values with the state of the environment | ||
|
| Step 4 | Link state of the environment to changing effects of agriculture | ||
|
| Step 5 | Link specific effects to specific conservation practices |
| Conservation tillage, wetland restoration, riparian buffers, noxious weed control, manure management, reduced fertilizer/pesticide use, irrigation practices, etc. |
| Step 6 | Link changes in conservation practices to specific incentives |
| Eligibility criteria, project ranking criteria, level of financial incentives, allocation of incentives, etc. |
|
Non-Market
Goods
|
Most environmental goods, such as clean air and water, and healthy fish and wildlife populations, are not traded in markets. Their economic value - how much people would be willing to pay for them in dollars ö is not revealed in market prices. The only option for assigning dollar values to them is to rely on non-market valuation methods. |
|
Non-Rival
Goods
|
One person's consumption of most goods (apples or housing) reduces the amount available for everyone else. Environmental goods are different. Clean water and air, beautiful views, and to some extent outdoor recreation, can be enjoyed by everyone in the same way as radio and television. The economic value of non-rival or public goods is the sum of all people's willingness to pay. |
|
Non-exclusive
Goods
|
People cannot be excluded from enjoying most environmental goods and the cost of trying to exclude them is prohibitive. Other than increases in onsite hunting and fishing opportunities, which may be a source of economic benefit to farmers, the environmental benefits of most conservation practices are non-exclusive. The free riders problem makes it impractical for farmers to recoup the cost of on-farm conservation investments from those who benefit from off-farm environmental improvements. |
|
Inseparable
Goods
|
Conservation practices at a given site contribute in many roundabout ways to environmental goods and result in environmental and economic benefits that accrue over great distances in time and space. It may be impossible to separate the economic benefits that result from one conservation practice undertaken at one site from another undertaken at another site. Worse, it may be impossible to separate the aggregate benefits of those practices from those of other environmental investments. |
