|
|
The information presented in this section is to assist NRCS field staff in developing and using conservation benefit indicators to rank and compare environmental investments. The section does not provide specific sets of indicators, nor does it recommend specific site or project ranking criteria. It does describe criteria that should be used to compare alternatives and shows how differences in site and landscape characteristics can be used to develop indicators related to those criteria. In
this section a farm site is treated as a natural resource system that
generates a mix of environmental services in addition to providing agricultural
products. We recommend that it be used as a tutorial that provides a basis
for understanding various methods that are being proposed for assessing
relative ecosystem values. We welcome feedback
about the information provided here and about information that is
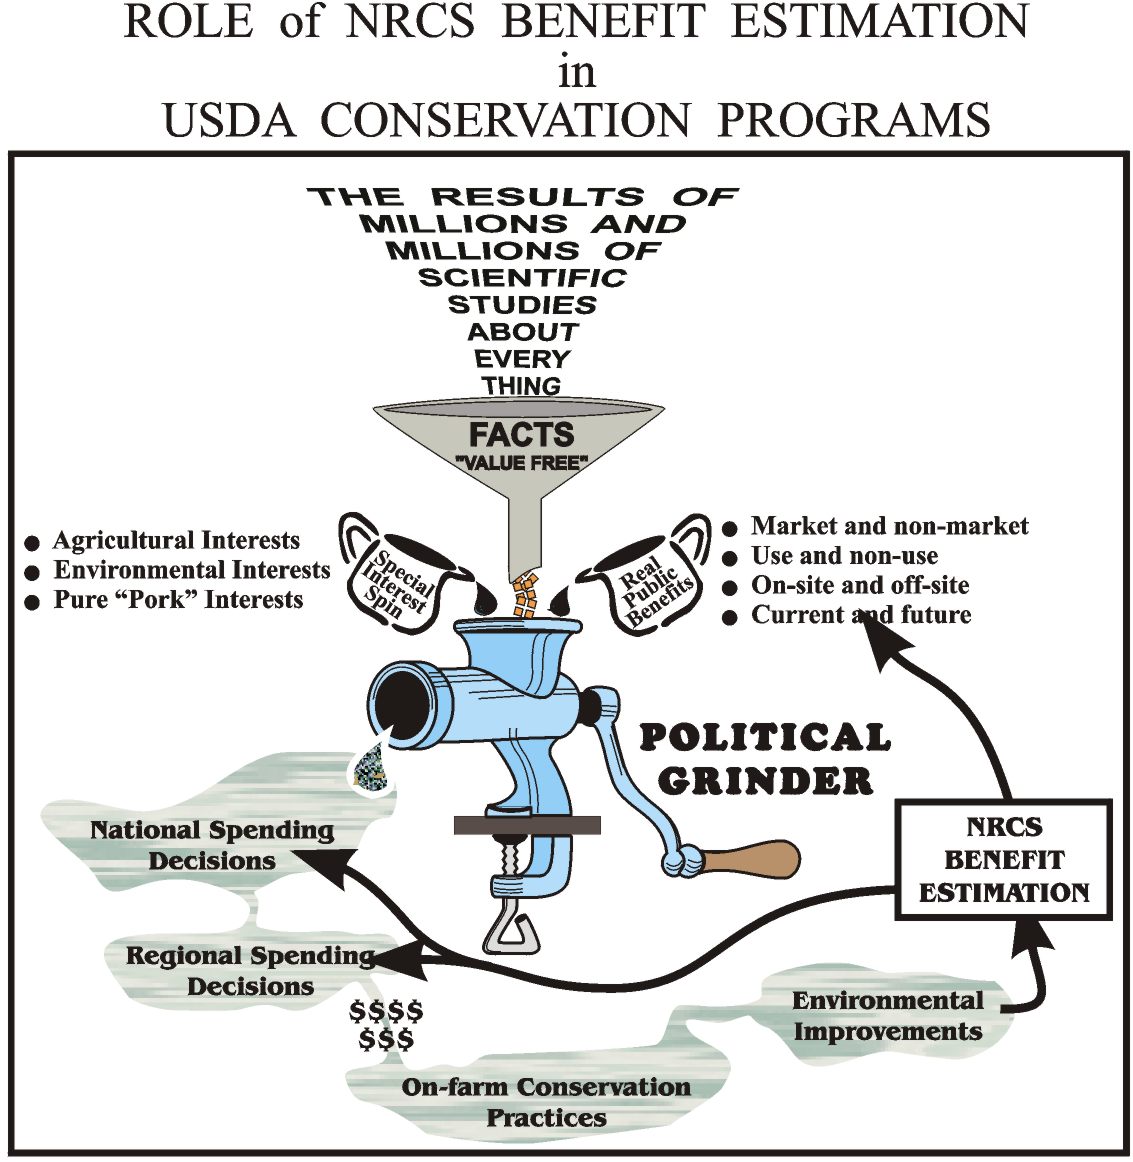
not here, but should be. Making decisions about conservation spending requires information about FACTS and VALUES. Those who control federal and regional environmental spending (e.g., green payments) have access to three sources of information about FACTS and VALUES. Scientists provide them with as much "value-free" FACTS as possible. Interest groups bombard them them with their spin on VALUES. Objective benefit estimation of the type described here provides them with a source of unbiased information about VALUES. As difficult and controversial as value-based research is, it is the only objective source of information that policymakers have about VALUES. Often it is the only credible basis for opposing the special interest spin on VALUES, and the only way to discourage wasteful environmental investments or ones that are not in the public interest. The following diagram shows the Big Picture. It depicts NRCS benefit estimation as an essential supplement to scientific research about FACTS, and a useful countervailing force to special interest spin about VALUES. Role of NRCS Benefit Estimation in USDA Conservation Programs The following chart provides an overview of where NRCS Conservation Benefit estimates fit into The Big Picture. It shows environmental policies and conservation spending decisions resulting from political decisions that are based on three sources of information: Assessments of Facts provided by scientist, biased assessments of Values provided by Special Interests, and objective assessments of Values provided by NRCS. Objective assessments of ecosystem values provided by NRCS provide an important supplement to scientific determinations about Facts and an important check on special interest spin about Values.
 Overview of Relative Ecosystem Values
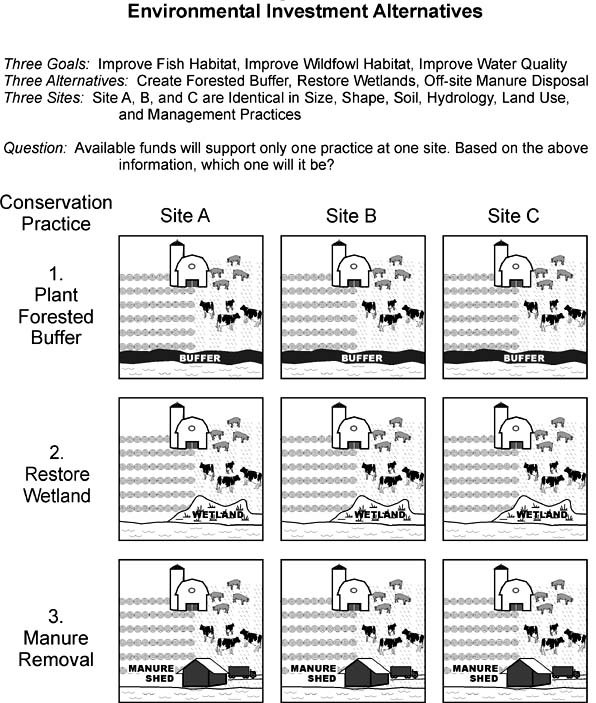
To get an idea of potential applications of indicators of relative ecosystem value consider the nine conservation spending alternative depicted in Figure 1. Applying any of the three practices at any of the three sites may be worthwhile. However, assume that "green payments" are available to fund only one of the practices at one of the sites, and that each practice at each site costs about the same. The question then would be: Which of the nine alternative spending decisions will provide the greatest environmental benefits?
The indicators outlined in this section will help answer this question.
Figure 1
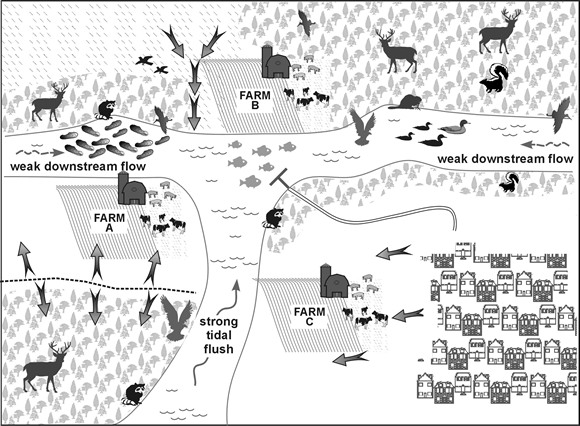
Clues as to how relative value indicators can be developed and improve spending decisions are provided in Figure 2 which puts the Sites shown in Figure 1 in their respective landscape contexts. A site's landscape context, quite apart from the onsite characteristics that may be the focus of a conservation project, has significant impact on the values provided by the site and the benefits of an onsite project. And landscape context does not only include the proximity of the site to other natural features of the landscape, such as water bodies and wildlife habitats. It includes its proximity to man-made features of the landscape, to people, and to problems caused by people. The approach to indicator development outlined in subsequent sections treats a farm as a resource system that provides a mix of valuable ecosystem services as well as a mix of valuable agricultural products. The landscape context of the farm site, in its broadest sense, includes the many factors that determine the mix of ecosystem functions and services it provides, who has access to them, how scarce they are, how useful they are, how replaceable they are, and so on. In conventional economics these would be called "leading indicators" of ecosystem values. In the context of the choices depicted in Figures 1 and 2 they reflect the expected environmental payoffs from environmental investment alternatives. A description of landscape differences that reflect the relative benefits from investing in each of the nine conservation alternatives is provided in the Illustration section under Illustration # 1: Conservation Alternatives.
Figure 2
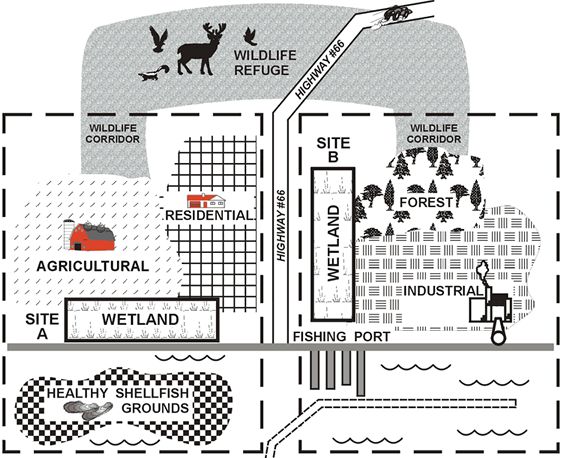
Another Clue about Relative Value Indicators
The bullet points listed below the graph point out some important difference between the two wetland sites that can be expected to affect their relative "values." The challenge of developing relative value indicators in this case, as in the previous depiction of nine competing conservation investment alternatives, is to quantify differences in landscape factors that can be expected to to enhance or inhibit the expected flow of benefits. An assessment of the differences in expected value of the wetland at Site A and at Site B and the development of some illustrative indicators are included in the Illustrations section under Illustration # 2 wetland trading.
Figure 3
Investing in the environment (Natural Capital) in many ways is similar to investing in children (Human capital) or highways (Manufactured Capital). Each type of investment generates public benefits in many "roundabout" ways that are difficult to trace and measure. For example, investments that reduce nutrient deliveries to nearby water bodies may, under certain landscape conditions, result in more Algae and more Submerged Aquatic Vegetation (SAV) and, depending on other landscape factors, may generate pathways of benefits as depicted in Figure 6. Measuring the effects of specific investments on each potential pathway of benefits (e.g., improved fish habitat), or tracing any "after-the-fact " measure of ecosystem value (e.g., better fishing) to a specific investment may be difficult or impossible. However, it is possible to use "leading indicators" to determine the likelihood that a specific investment will contribute to the building blocks of ecosystem benefits. Understanding these building blocks provides a basis for designing useful indicators for managing environmental investments. In this regard making smart investments in in the environment is very much like making smart investments in good schools or efficient highway systems. "After-the fact" measures of benefits that may take years to appear and may accrue many miles away are not very useful for assessing or comparing investments in schools, highways, or environmental resources. These investment decisions need to be based on "leading" indicators of what is likely to succeed or fail . The indicators developed in subsequent sections focus on how the landscape context of a site determine what building blocks of ecosystem value are present and, therefore, how changing conditions at a site through a conservation practice is likely to generate ecosystem values.
The indicator development tools presented in this Section are based on three conventional concepts that are central to most types of production and investment analysis:
The logic behind the types of relative indicators developed in this section is based on the following four hypotheses. Each can be tested for a particular region or conservation district to determine if the indicators provide useful distinctions for assessing and comparing environmental investments. Four Testable Hypotheses
Resources to support indicator development include topographical maps, soil maps, land use maps, natural resource and habitat maps, and demographic and socioeconomic data. With some upfront investments in GIS applications the benefit indicators related to specific environmental services could be accessed merely by providing the zip code or lat./long. coordinates of the site. Plans
Click
for a Checklist
of data resources.  |
![]()